Zopone
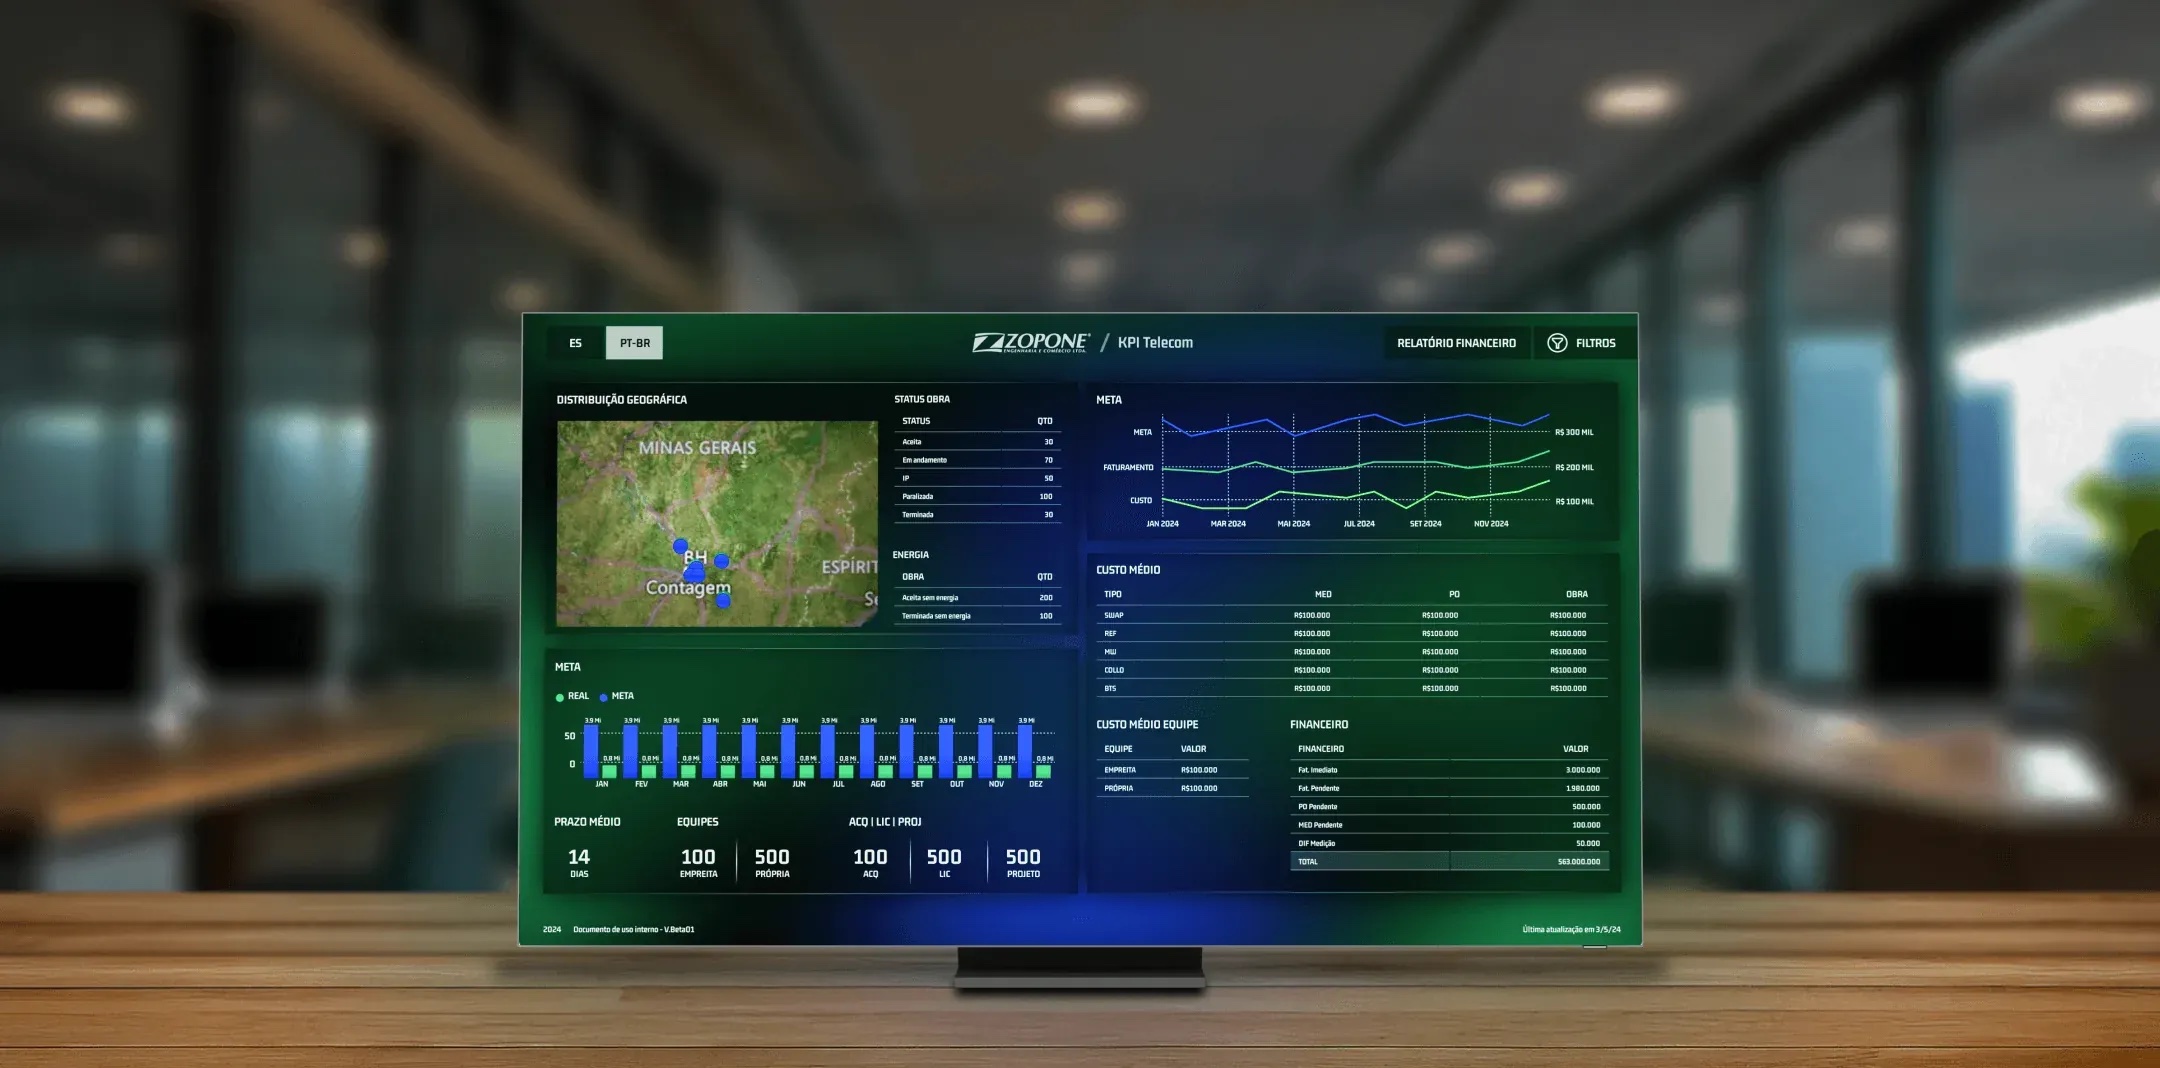
A futuristic data dashboard designed to optimize large volumes of information into concise, intuitive visuals for real-time insights
- Industry
- Telecom
- Service
- Data Design
- Type
- Web
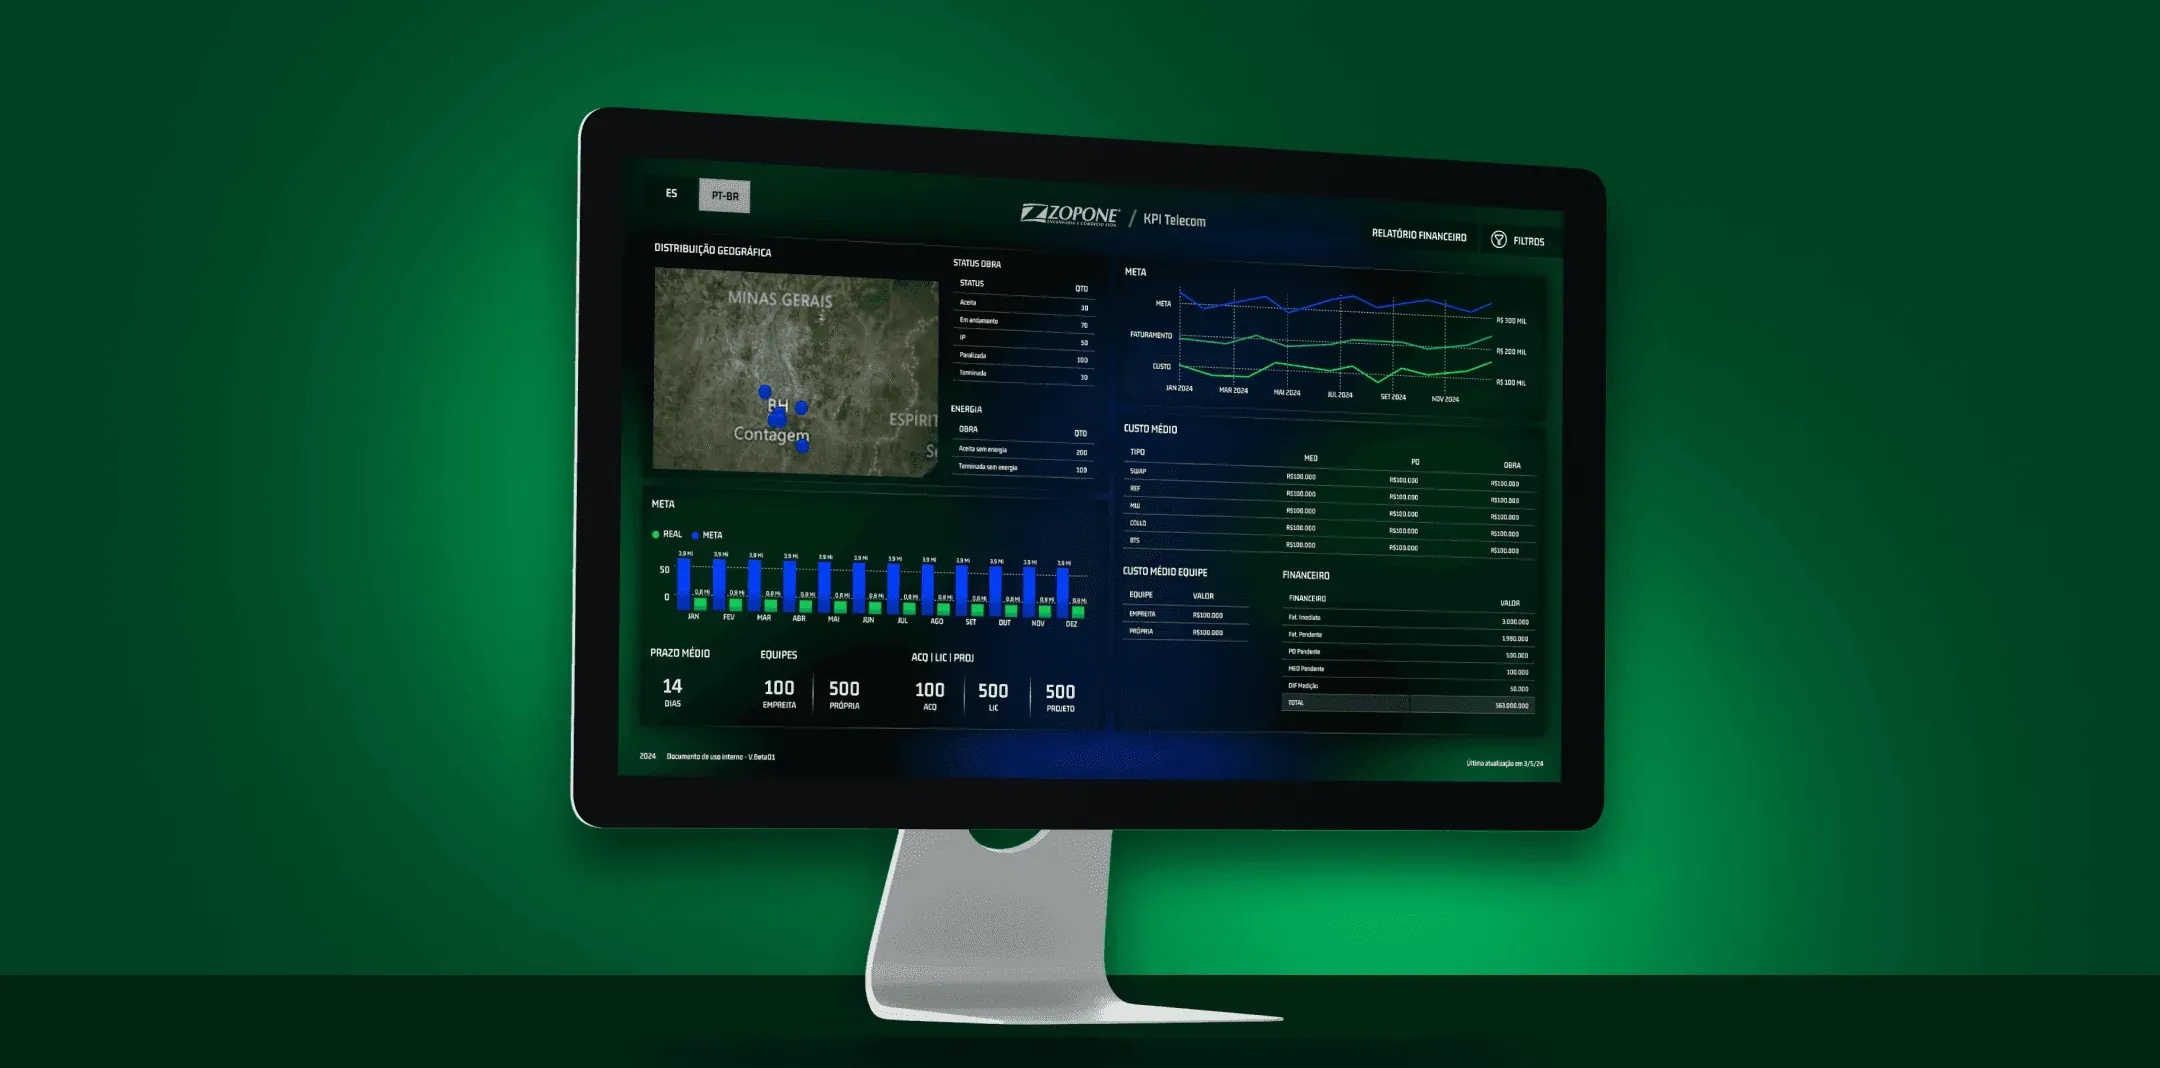
Context & problem
Zopone, a telecom company, needed a futuristic data dashboard to turn large volumes of operational information into concise, intuitive visuals for real-time insights.
- Information overload — Operations generated more data than teams could read.
- No real-time view — Decisions depended on reports that were already outdated.
- Hard to compare — Spotting trends across regions and teams took too long.
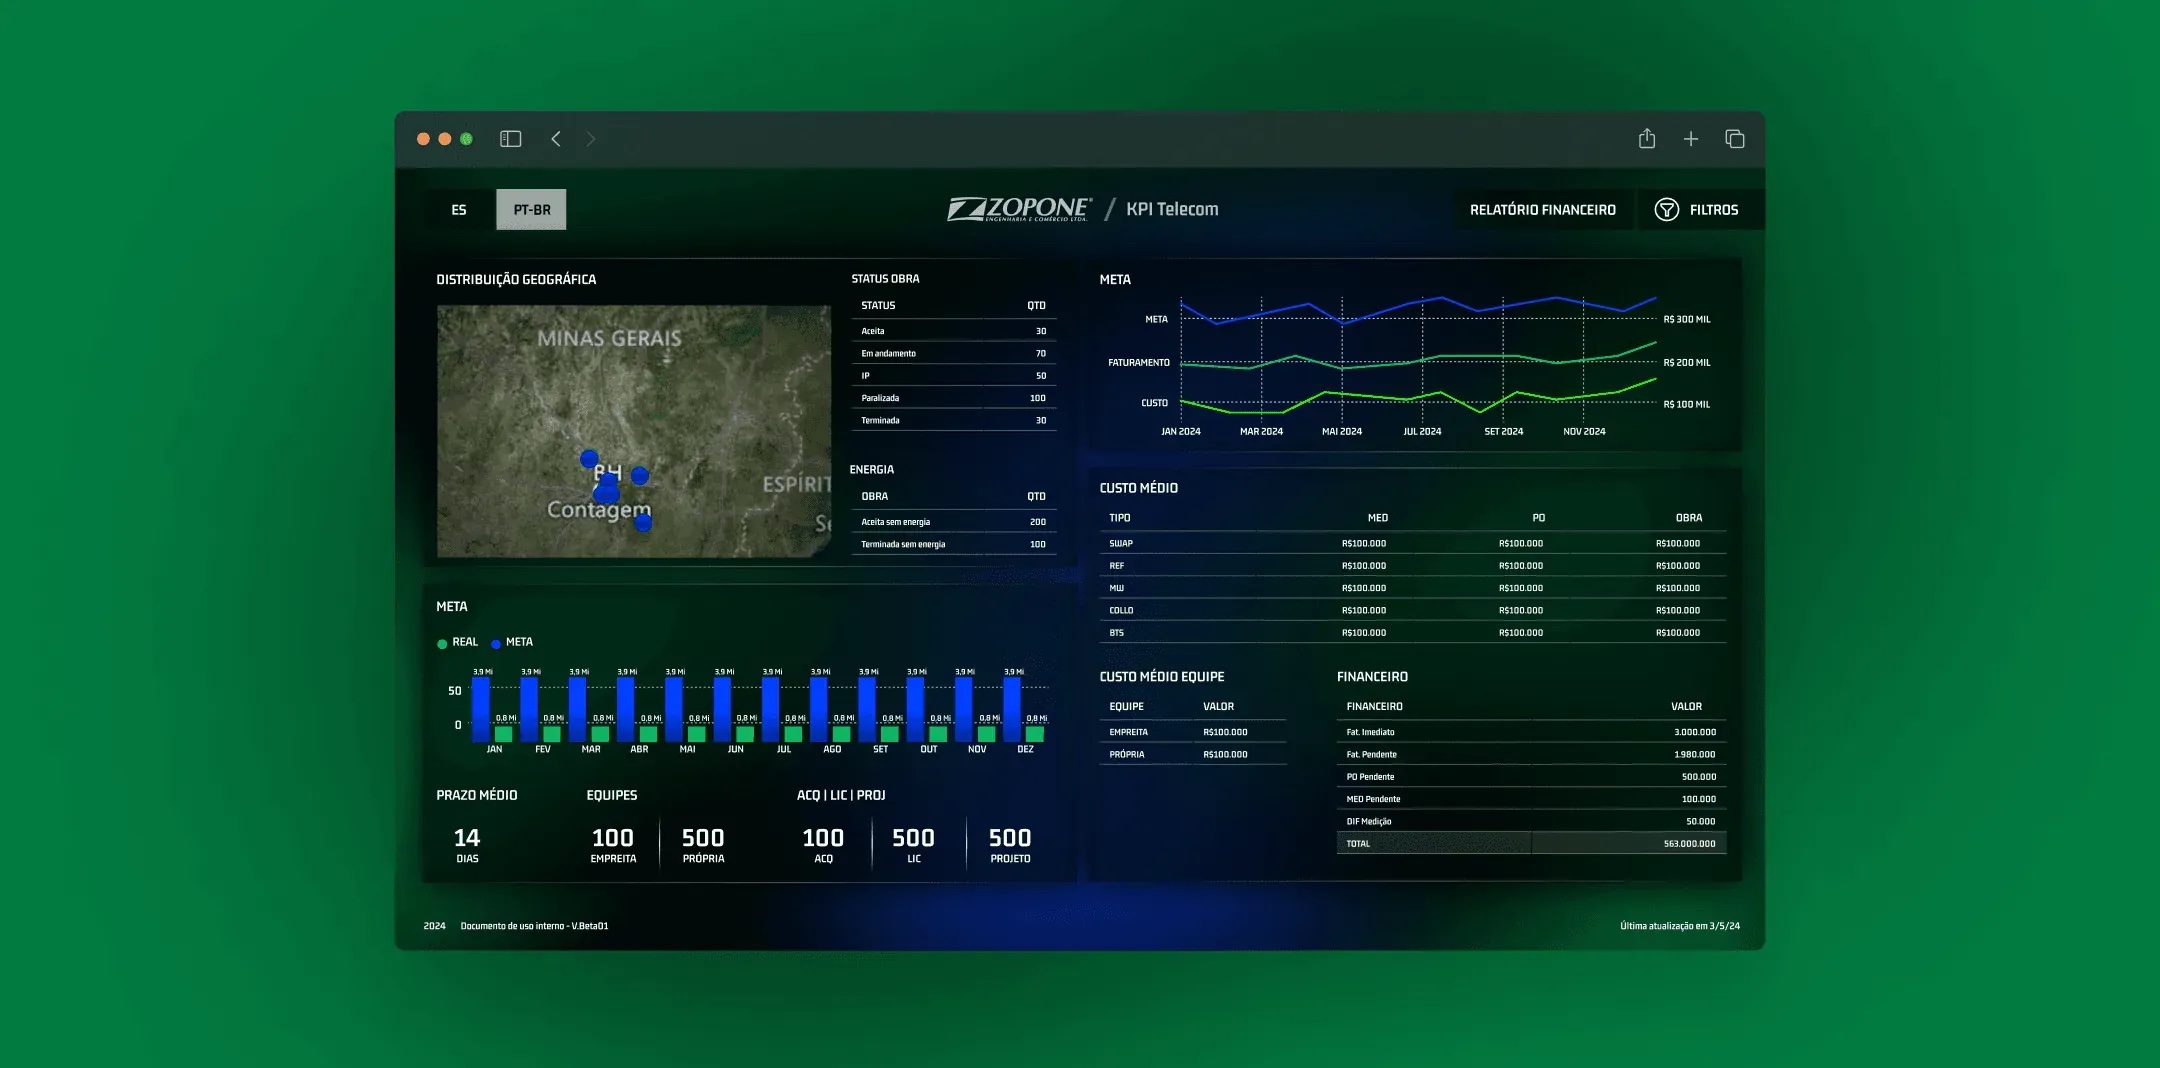
Process & discovery
I designed the dashboard with the operations team, prioritising the metrics that drive daily decisions.
- Map — Key questions and metrics for each team.
- Prioritise — A hierarchy of KPIs from overview to detail.
- Visualise — Futuristic, high-contrast charts built for fast reading.
- Refine — Iterations with real data and user feedback.
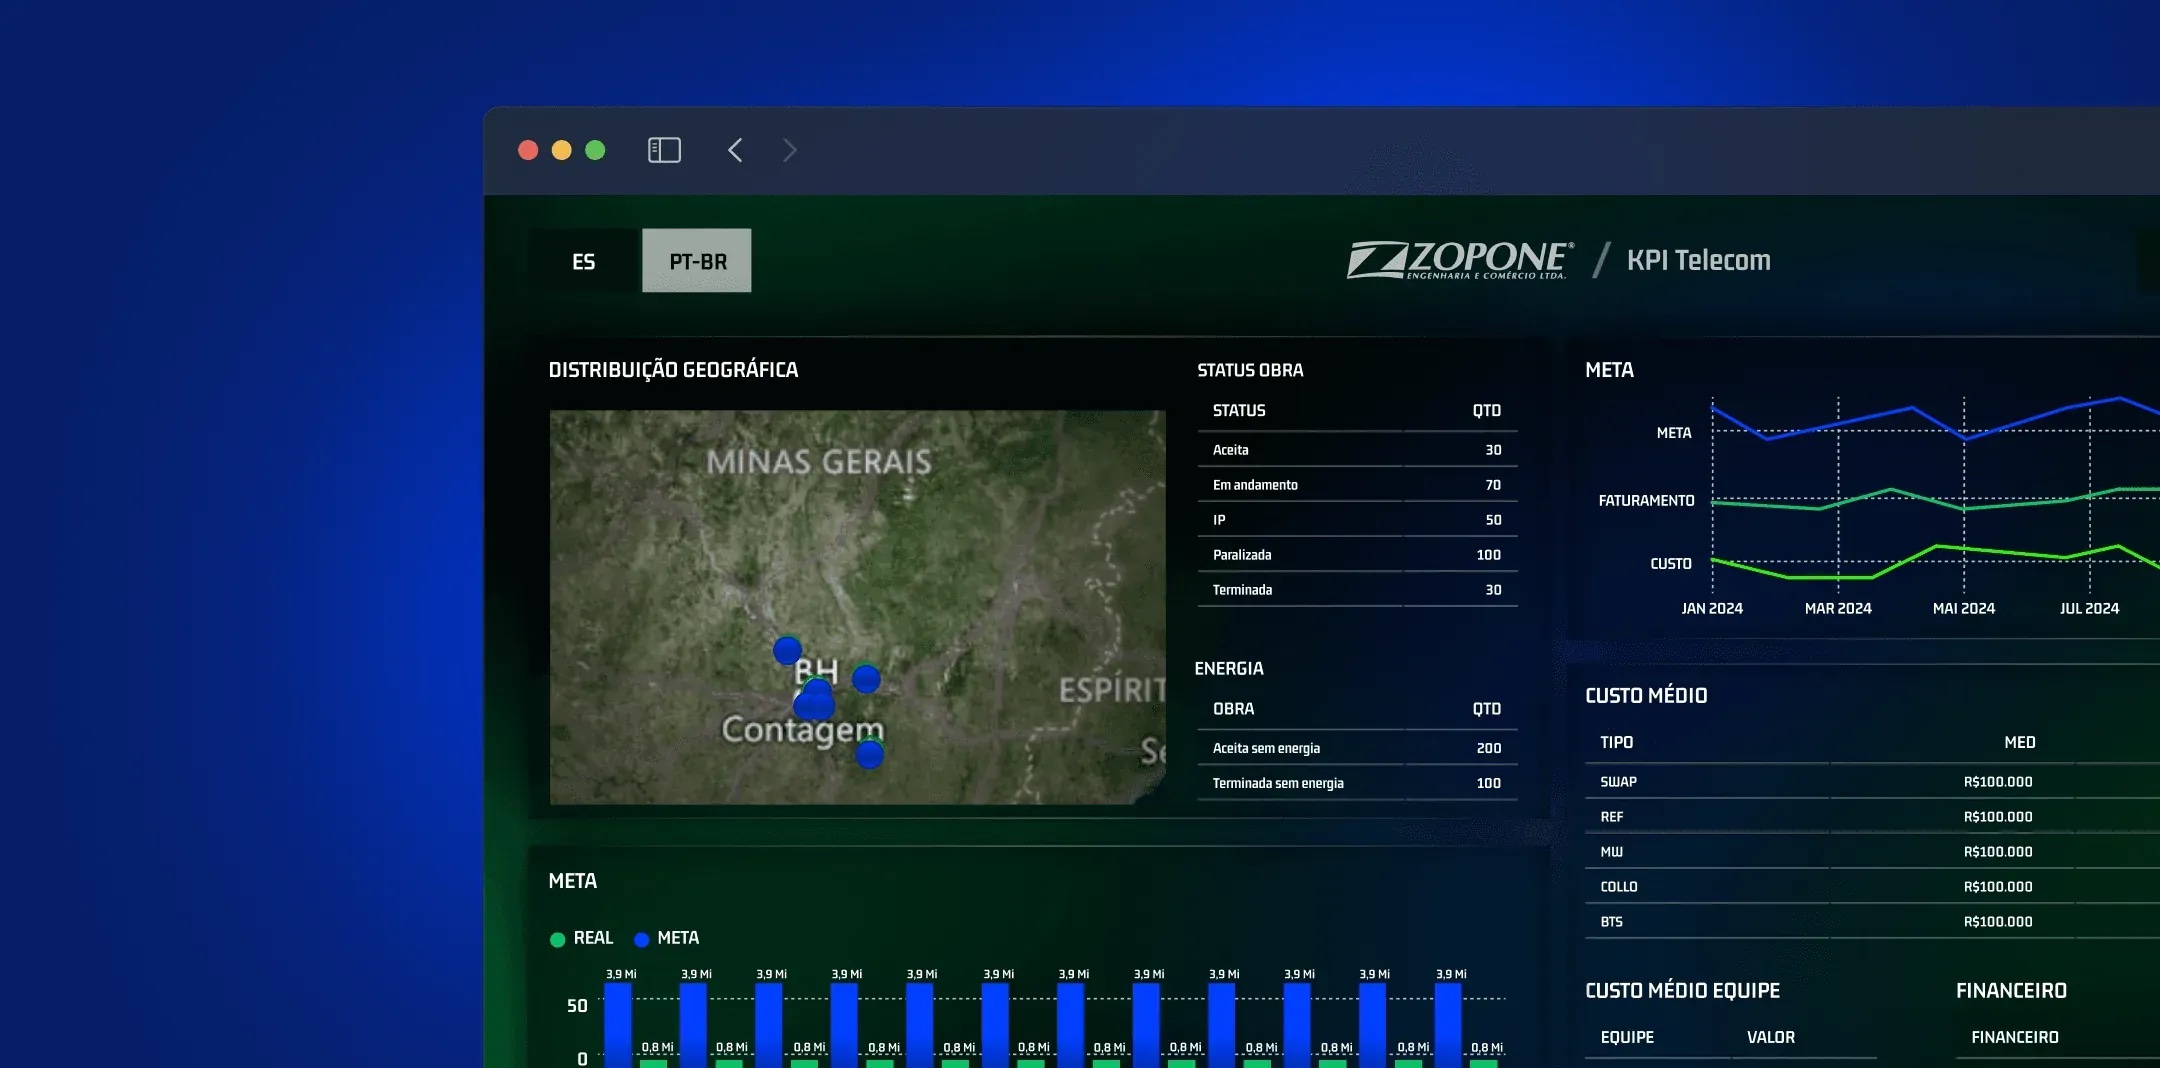
Results
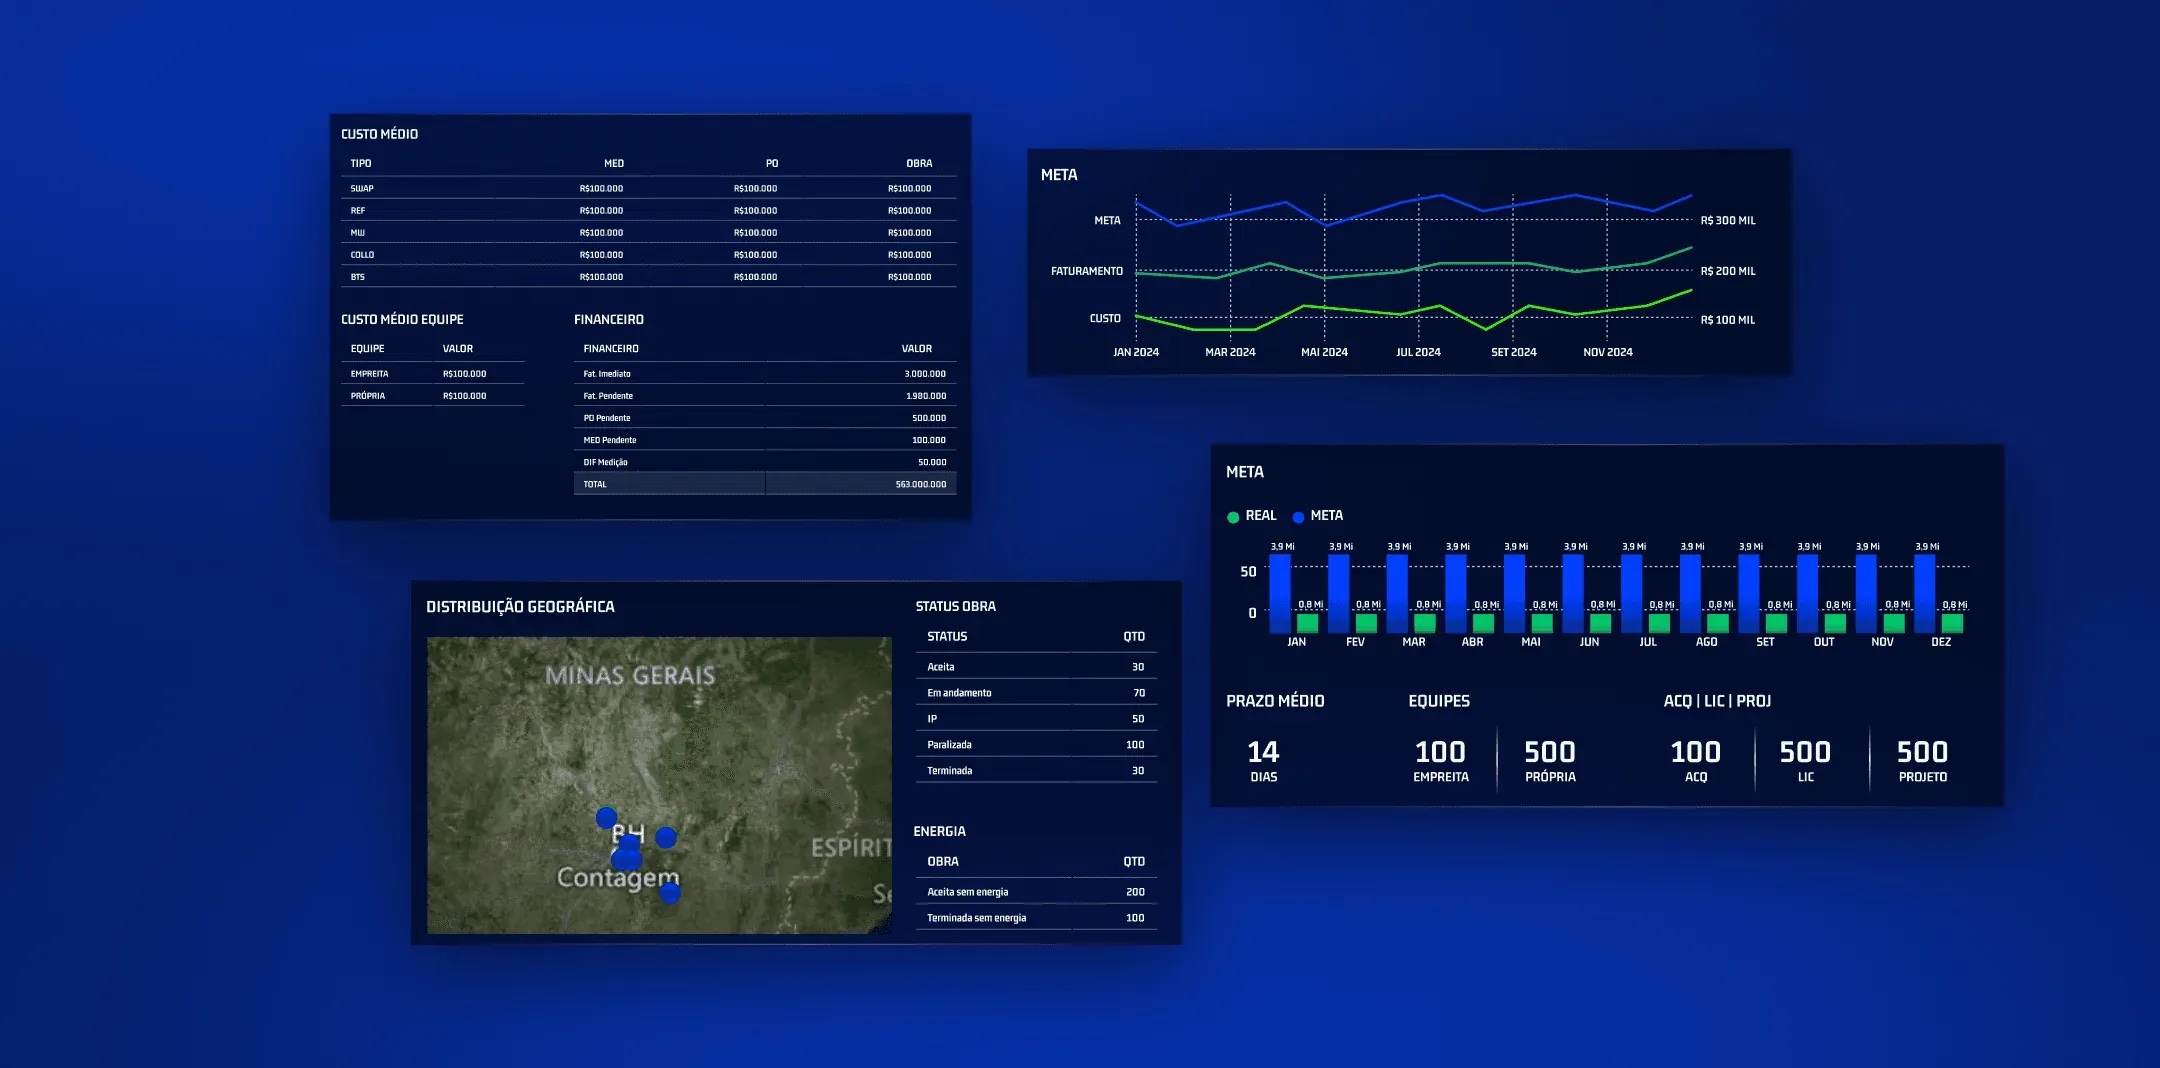
The dashboard condensed large data sets into clear, real-time views for telecom operations.
- Real-Time — Telecom Insights
- Large Data Sets — in Concise Visuals
Tools
The stack I used across research, design and handoff.
- Figma — UI & Prototypes
- Miro — Research & Flows
- Maze — Usability Tests
- Jira — Specs & Handoff
Learnings
- Overview first — A high-level view with drill-down kept screens focused.
- Contrast guides the eye — A dark, high-contrast style made key numbers pop.
- Real data, real design — Live data shaped the layout more than any mockup.