Embrapii
Data dashboard designed with optimized visualizations, transforming complex information into intuitive real-time insights.
- Industry
- Industrial Inovation
- Client
- Embrapii
- Service
- Data Design
- Type
- Web
Context & problem
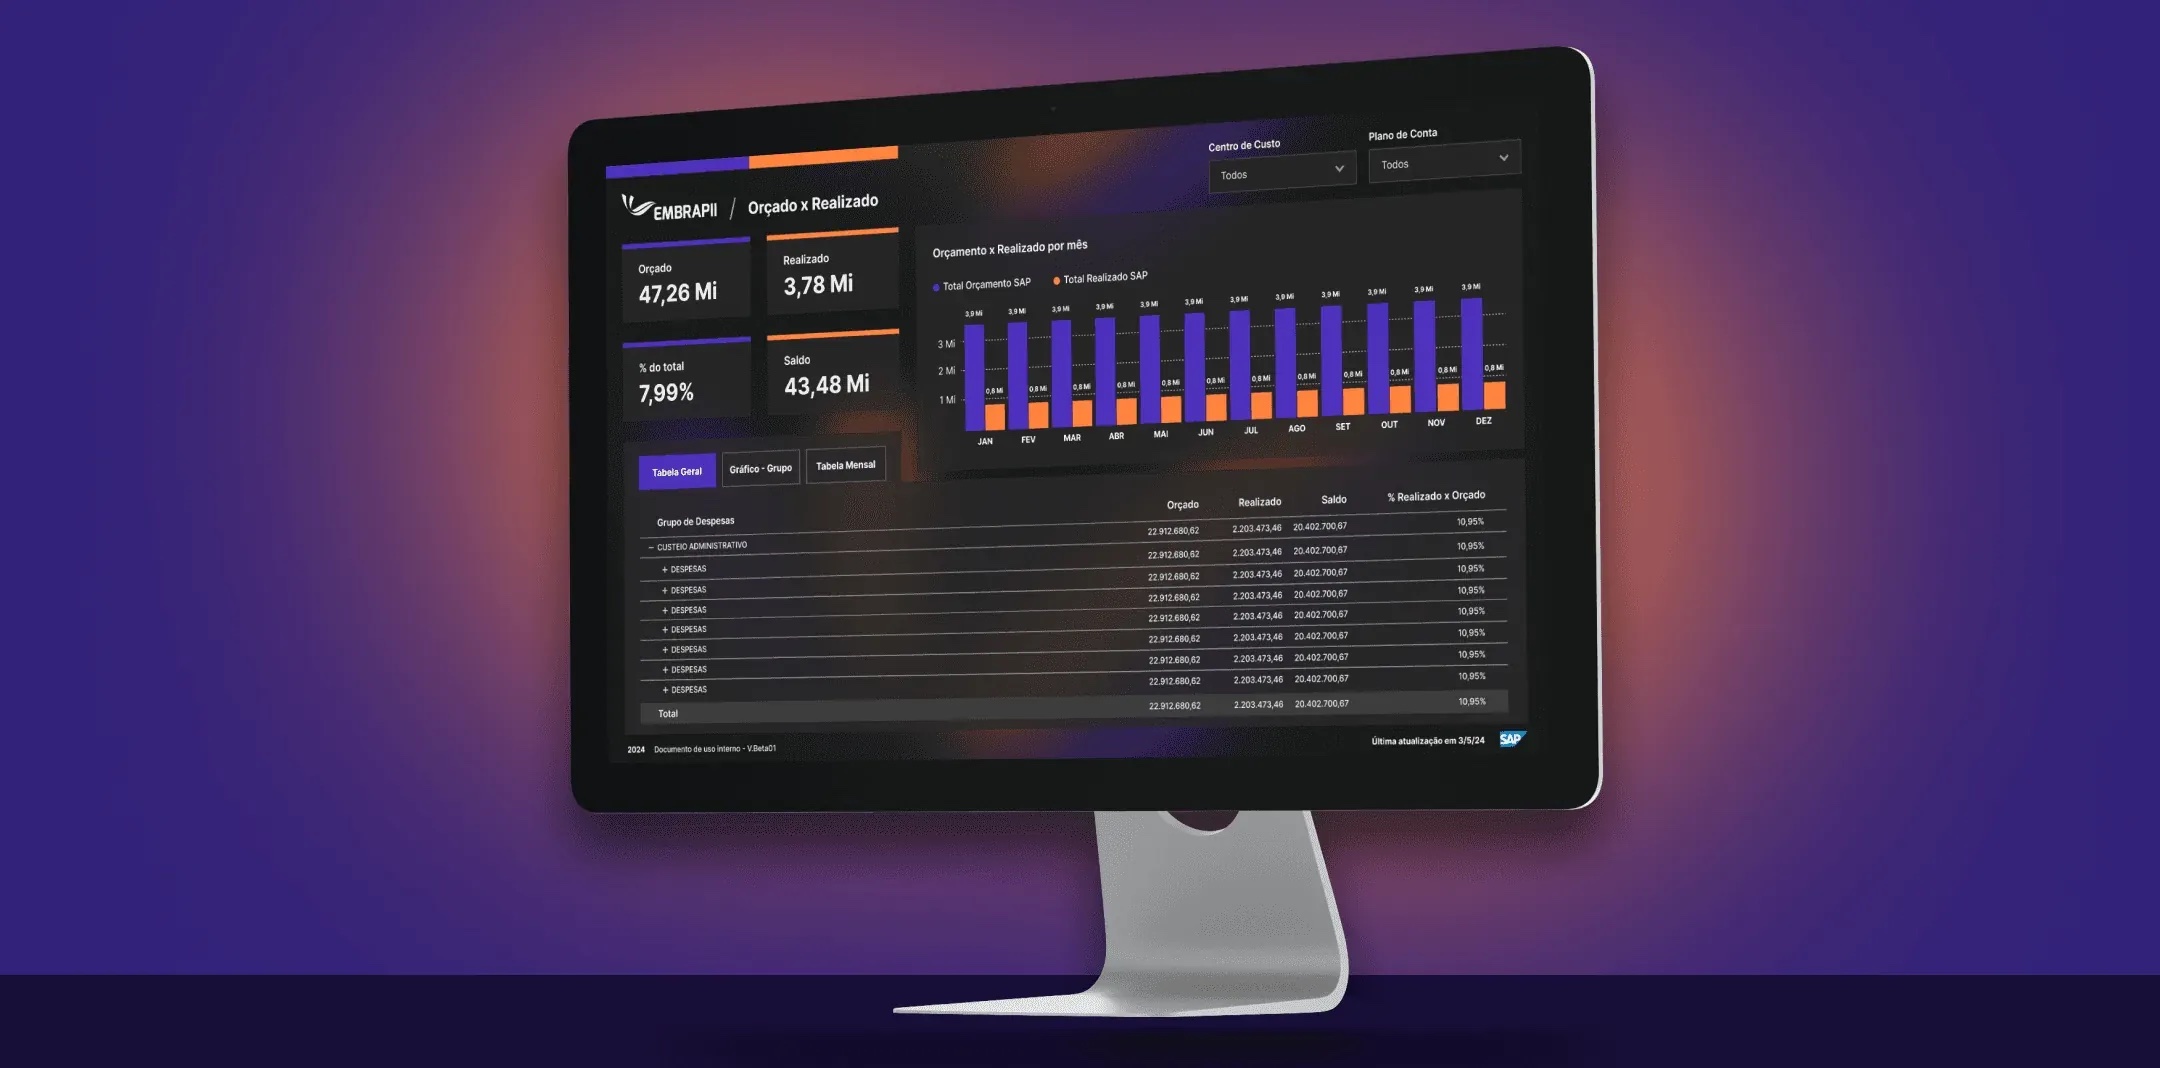
Embrapii funds industrial innovation in Brazil and needed a data dashboard to turn complex project and investment information into clear, real-time insights.
- Too much data — Large volumes of information were spread across reports and spreadsheets.
- Slow decisions — Managers waited for manual reports to understand performance.
- Hard to read — Dense tables made trends and outliers difficult to spot.
Process & discovery
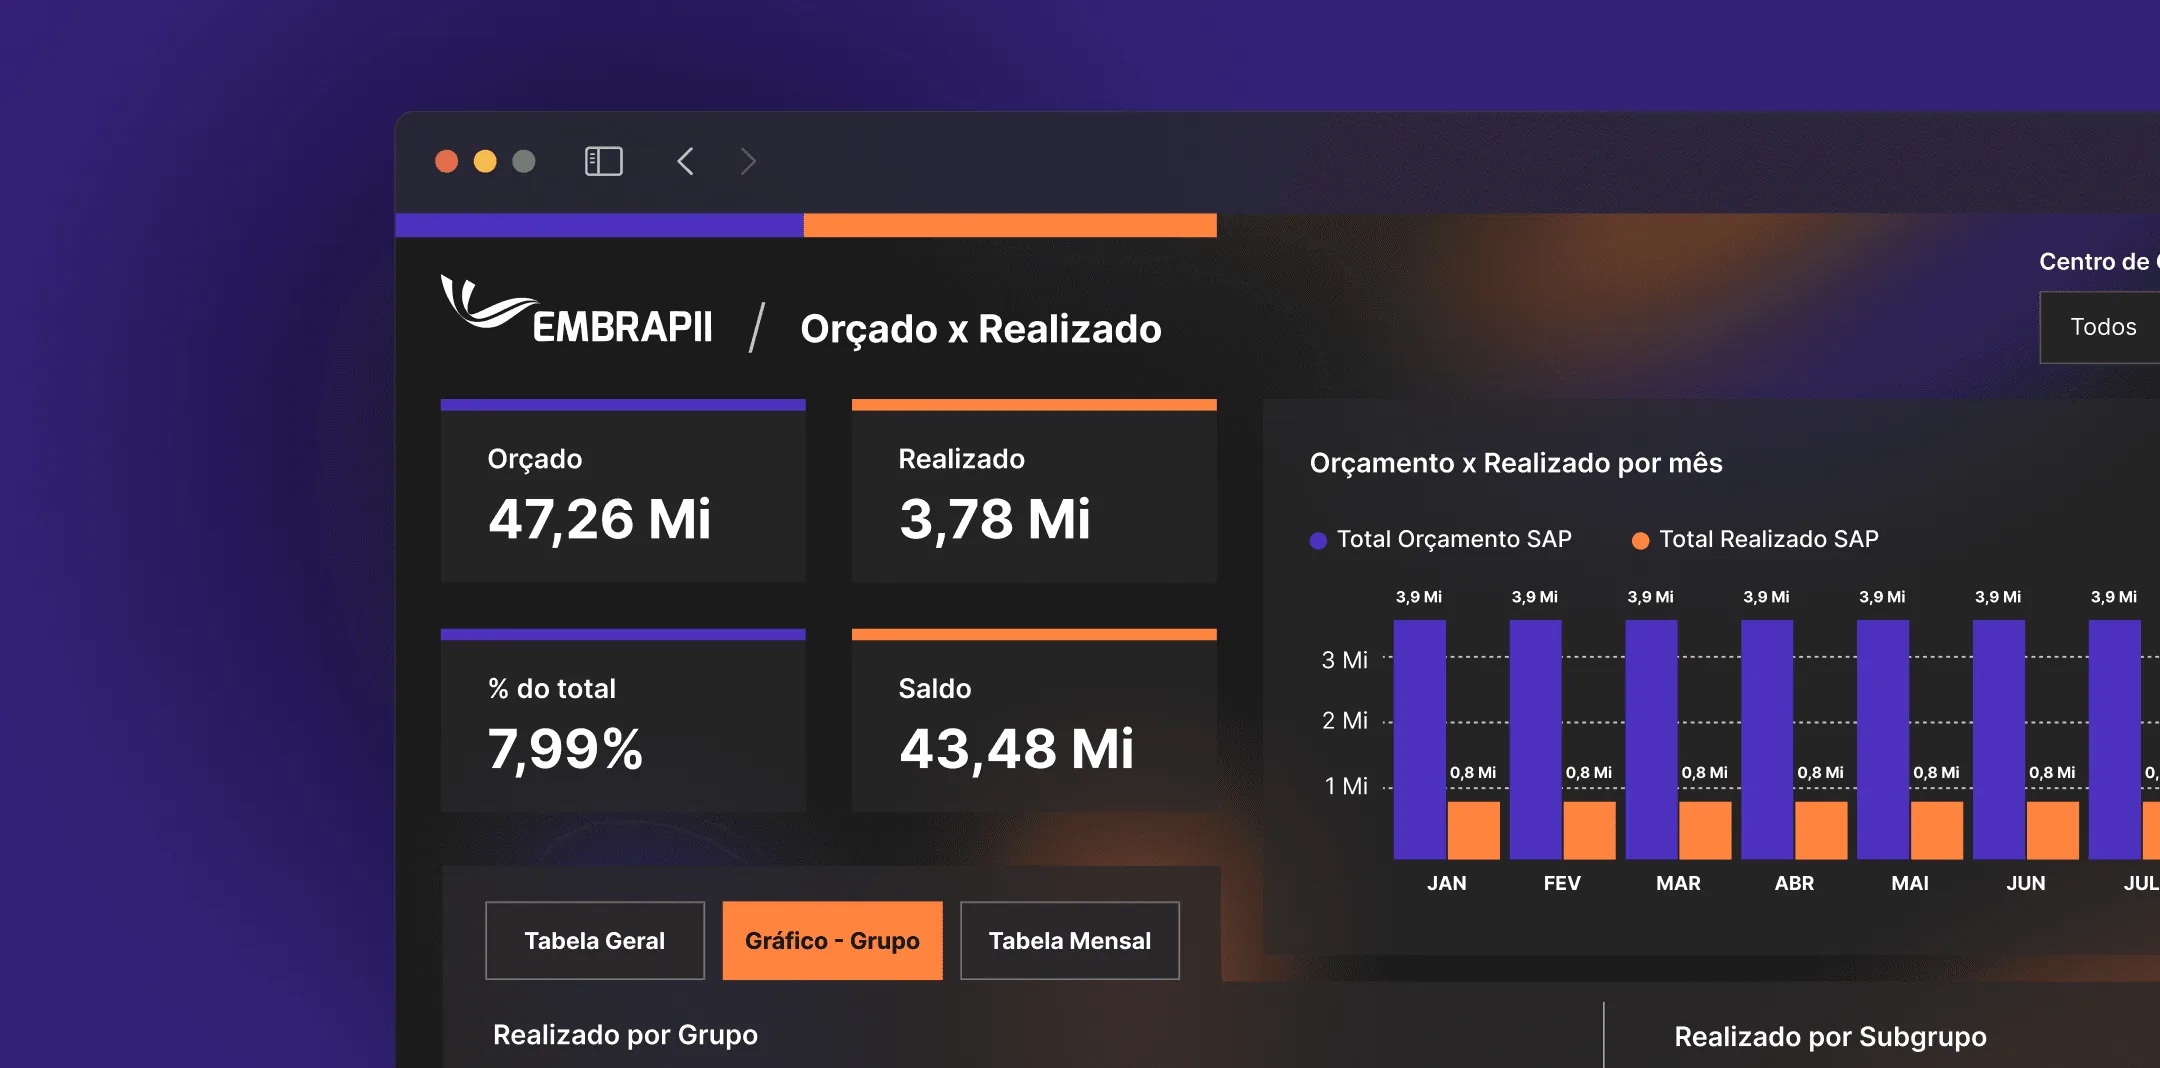
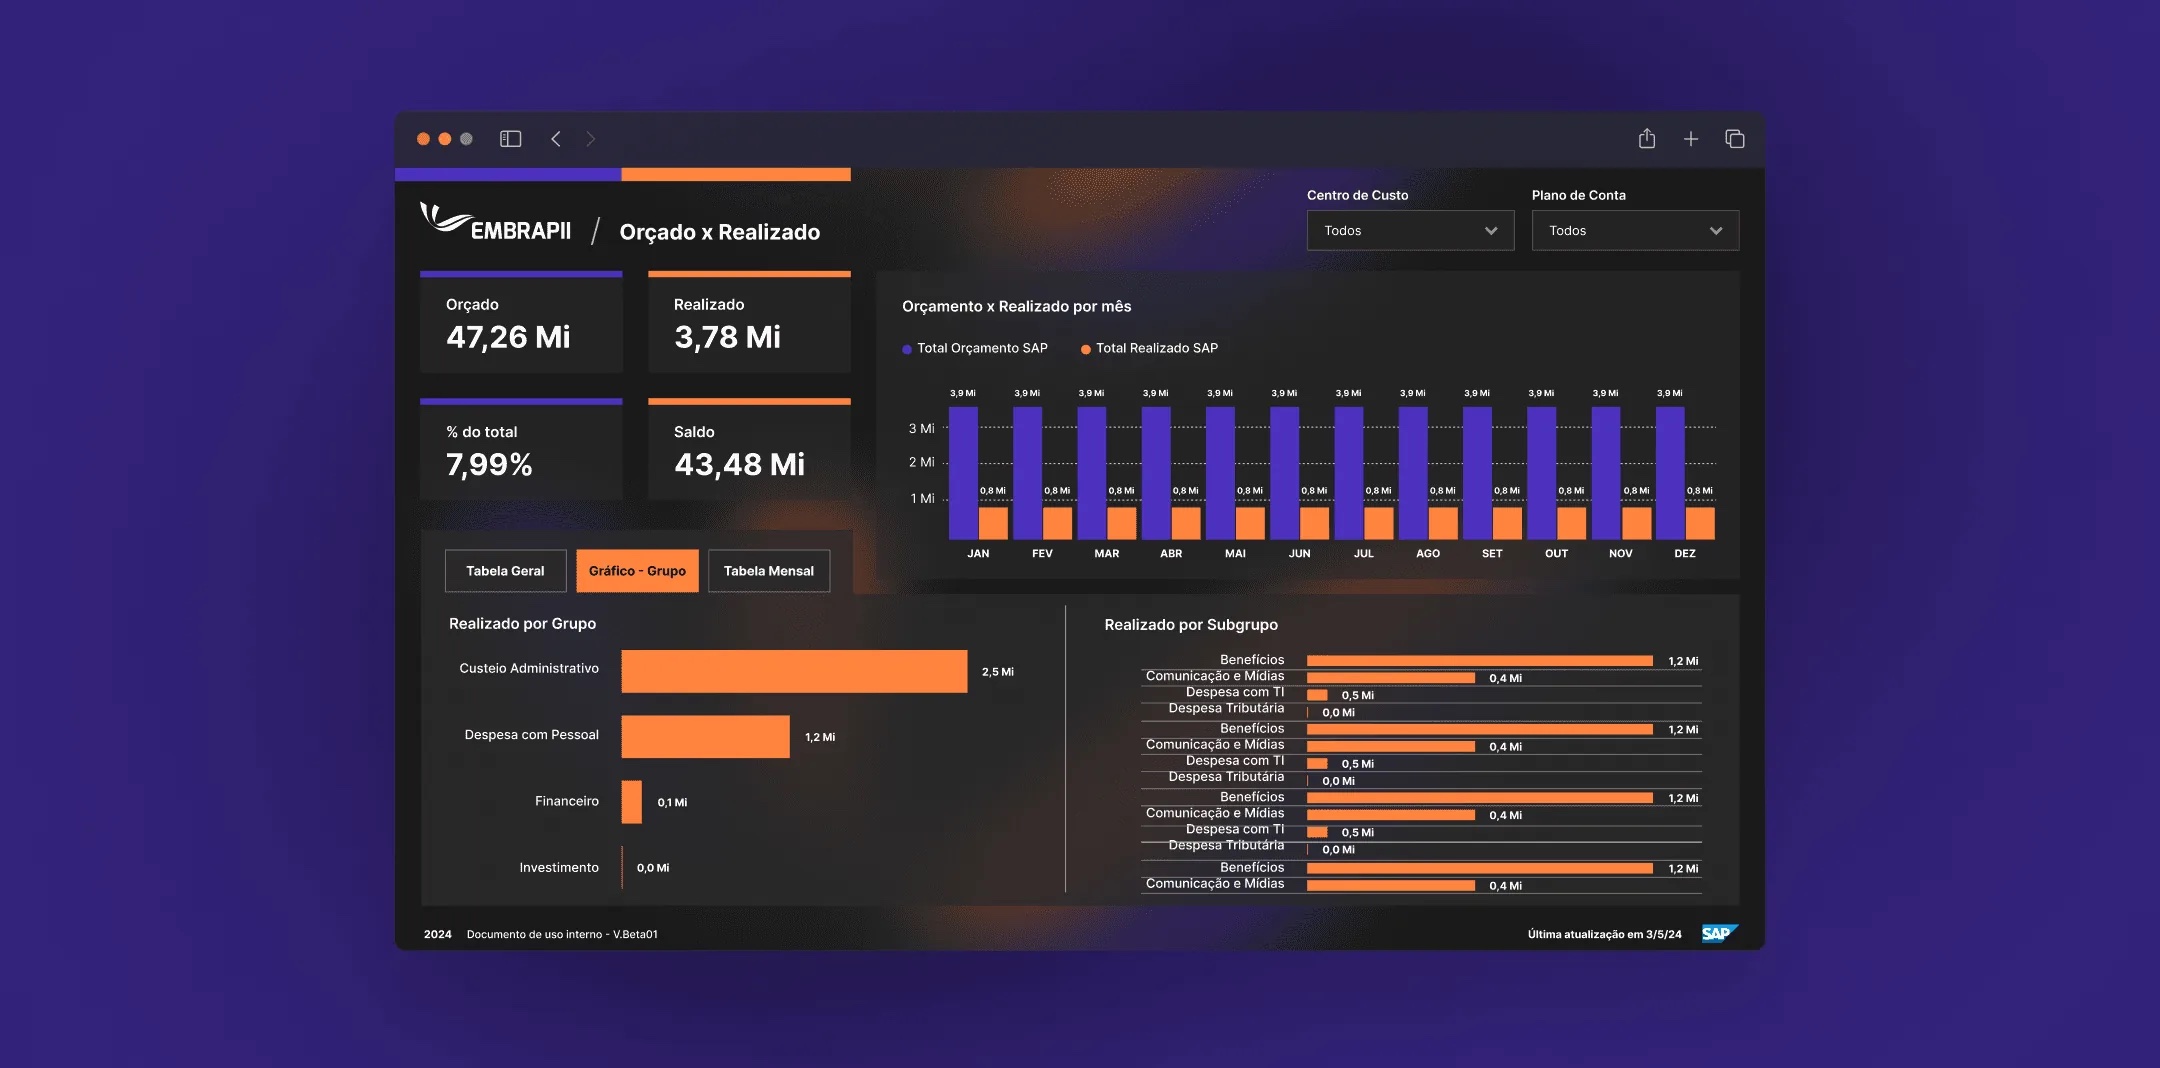
I worked with the data and business teams to define what each audience needed to see, then designed visualisations that answer those questions at a glance.
- Map — Interviews to list the key questions each user needs to answer.
- Structure — Information hierarchy and KPIs organised by priority.
- Visualise — Charts chosen and designed for clarity and fast reading.
- Refine — Iterations with real data to test readability and accuracy.
Results
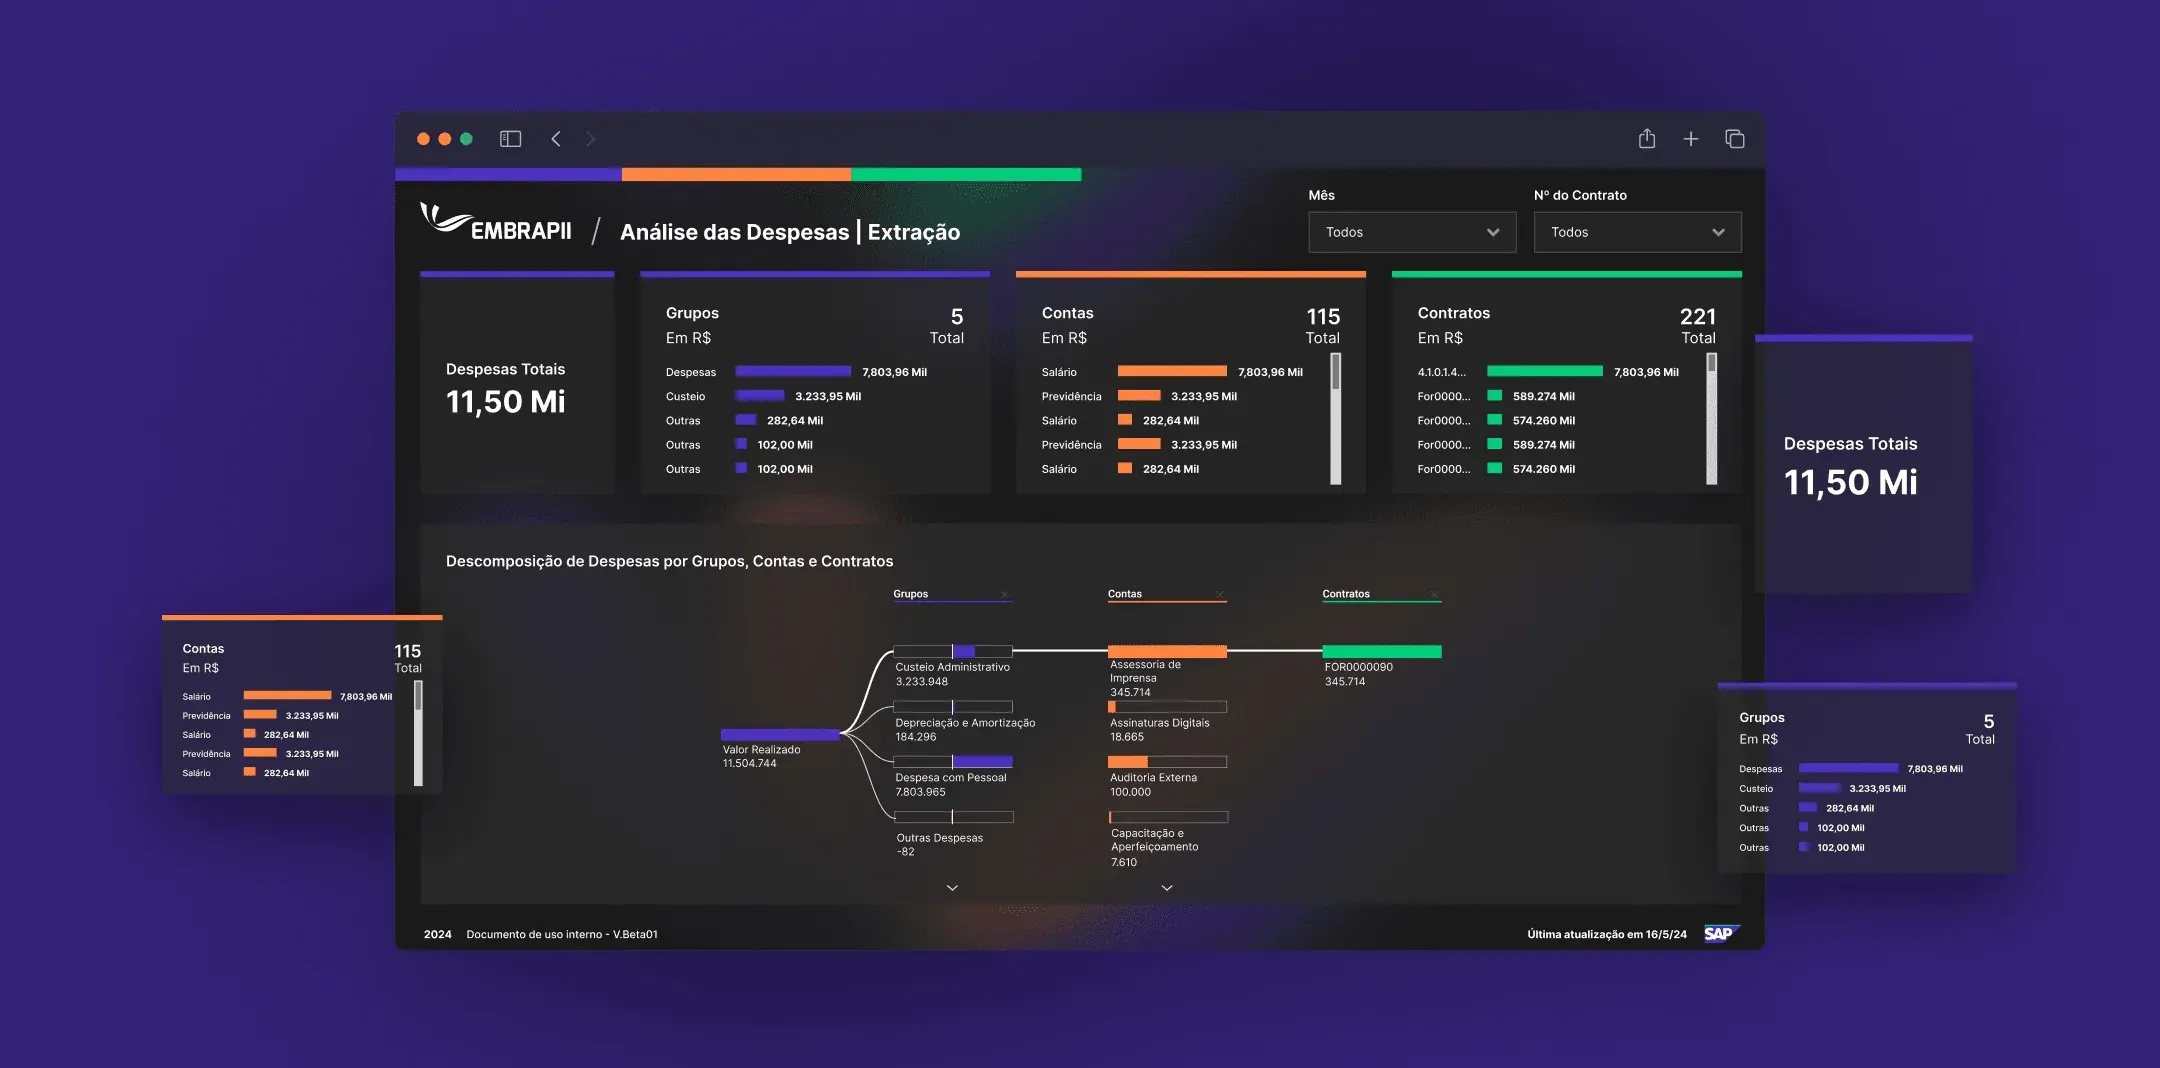
The dashboard brought innovation data into one place, readable in seconds instead of hours of report digging.
- Real-Time — Innovation Insights
- Complex Data — Made Readable
Tools
The stack I used across research, design and handoff.
- Figma — UI & Prototypes
- Miro — Research & Flows
- Maze — Usability Tests
- Jira — Specs & Handoff
Learnings
- Start with the question — Every chart had to answer a real decision, not just show data.
- Less is clearer — Removing decoration made the important numbers stand out.
- Design with real data — Testing with live numbers revealed edge cases mock data never shows.